Getting to Know What a Dashboard Is and Its Important Role for Business
Data is new gold
This saying took off a few years ago, ever since digital platforms, paired with the growth of internet access, turned everything into an app — and then it turned out everything could become data. Including in business.
Awareness of how important data is for decision-making has grown ever since. Unfortunately, that awareness has not been matched by the knowledge of how to process and make use of that data.
If we tie it back to the saying earlier, many people already know that data is valuable and they have it, but not many know how to process and make use of it.
What is a Dashboard?
The dashboard we are talking about here is not the one inside a car, but rather a compact display that delivers valuable insight from the data you have collected. The data can come from business activities, finances, or even our own activities.
Unlike a data view in Excel or a spreadsheet, which is an arrangement of numbers across dozens of cells and rows, a dashboard is the essence and the information we can extract from those numbers.
To make it easier to understand, I will give you an illustration in the form of a spreadsheet containing tens of thousands of data entries, like the one below.
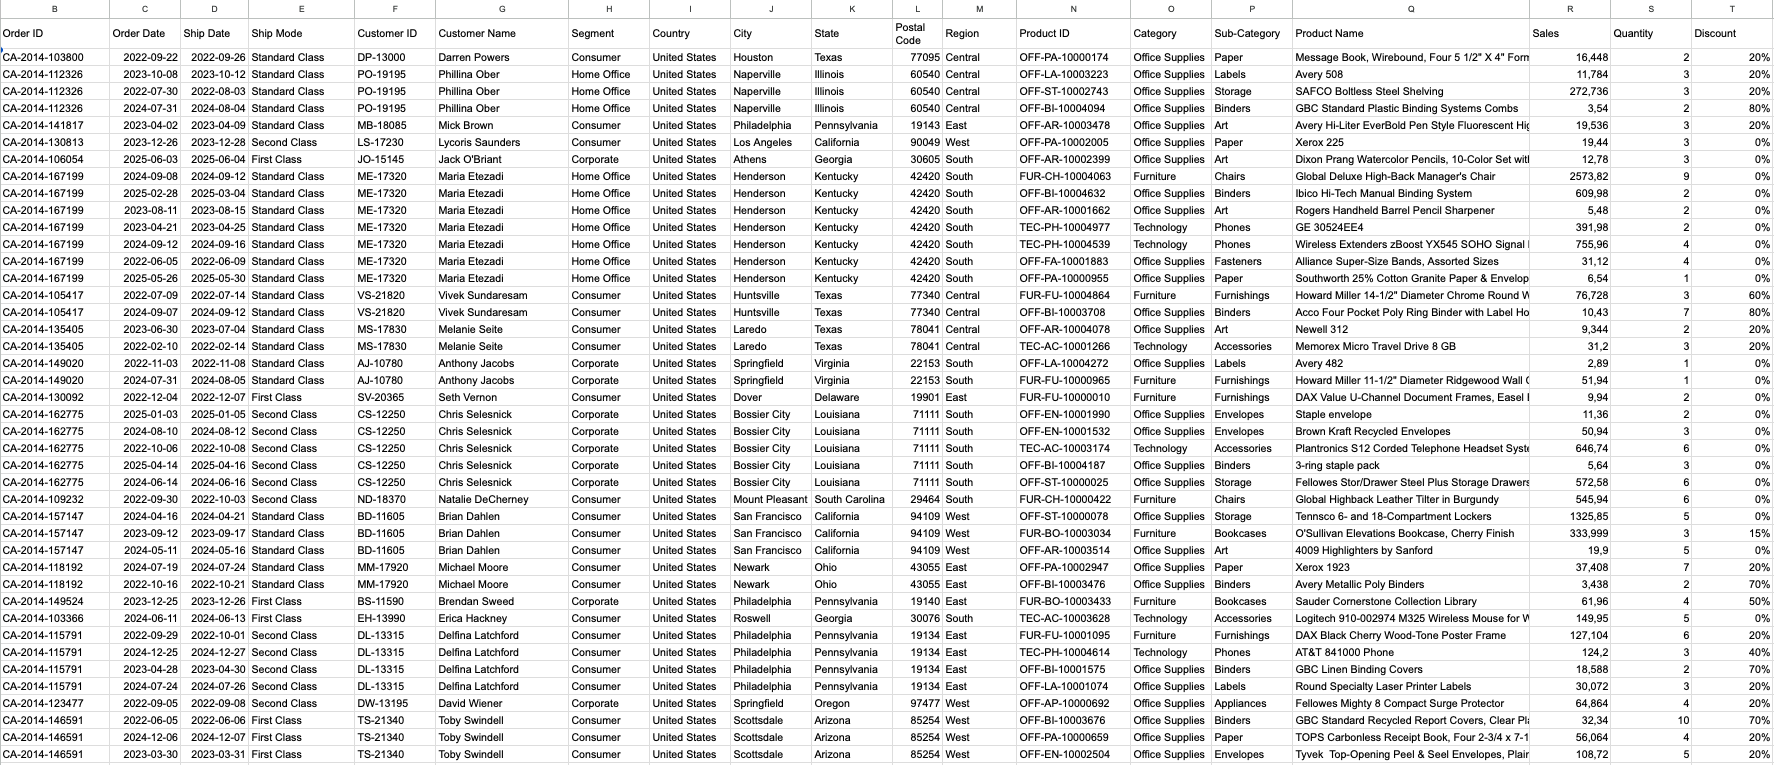
The image above is an example illustration of a spreadsheet containing sales data. There are 10 thousand rows in total.
If there were only a small amount, of course we could still comfortably read and analyze it directly from the spreadsheet, but what if there are already 10 thousand rows and the data spans several years?
This is where the dashboard plays its important role: to analyze those numbers, turn them into insight, and most importantly to be dynamic and real-time — allowing the business owner to make decisions quickly and accurately.
So, a dashboard is a compact display that can combine data from various sources into insight that is alive (real-time). You can read a simple analogy of this in my earlier piece on Telling Data, Reports and Dashboards Apart.
Why Is a Dashboard Important for Business?
Why do business owners or Top Level Management need to have and look at a dashboard? There are at least a few things worth considering.
Realtime – Make Decisions Faster
A dashboard is usually realtime; if the source data changes, it will update automatically. With this, a business owner or decision-maker can make business decisions more quickly and accurately.
This is especially valuable for busy business owners or Top Level Management who spend much of their time on the move and in meetings. There is no need to analyze and request data from the team, because everything is already realtime.
Time Saving – No Need for Manual Reports
If you previously were a business owner who relied heavily on spreadsheets or Excel, once you have a dashboard you will have more time on your hands.
The time that used to be eaten up by analyzing data manually will be gone, because everything is already in the dashboard.
Likewise, if all this time you have been relying on requesting data from your team, their working hours can now be focused on inputting data and doing more impactful work.
In fact, in Looker Studio there is a feature that can send you a report from the dashboard automatically via email at whatever frequency you want (daily, weekly, monthly).
Identify Problems Faster
Because of its realtime nature, a dashboard can help you as a business owner identify problems early, before they grow big.
Based on my experience, business owners who rely only on Excel or spreadsheets usually do not see the problems, or even the positive performance, of their business.
That is because the numbers in a spreadsheet or Excel are not user-friendly and do not give a picture of what is actually happening.
What Do You Need to Build a Dashboard?
If you want to build or learn about dashboards, there are a few things you will need:
Data Source
This is usually an Excel file or spreadsheet that is updated periodically.
BI Tools
Next, what you need is Business Intelligence Tools. Some are free, some are paid. In terms of difficulty and cost, you can start with Looker Studio – a tool from Google that is easy to use and works very well if your data is in a spreadsheet.
Dashboard Example
Below is an example of a sales dashboard I built using dummy data. The data amounts to roughly 10 thousand rows.
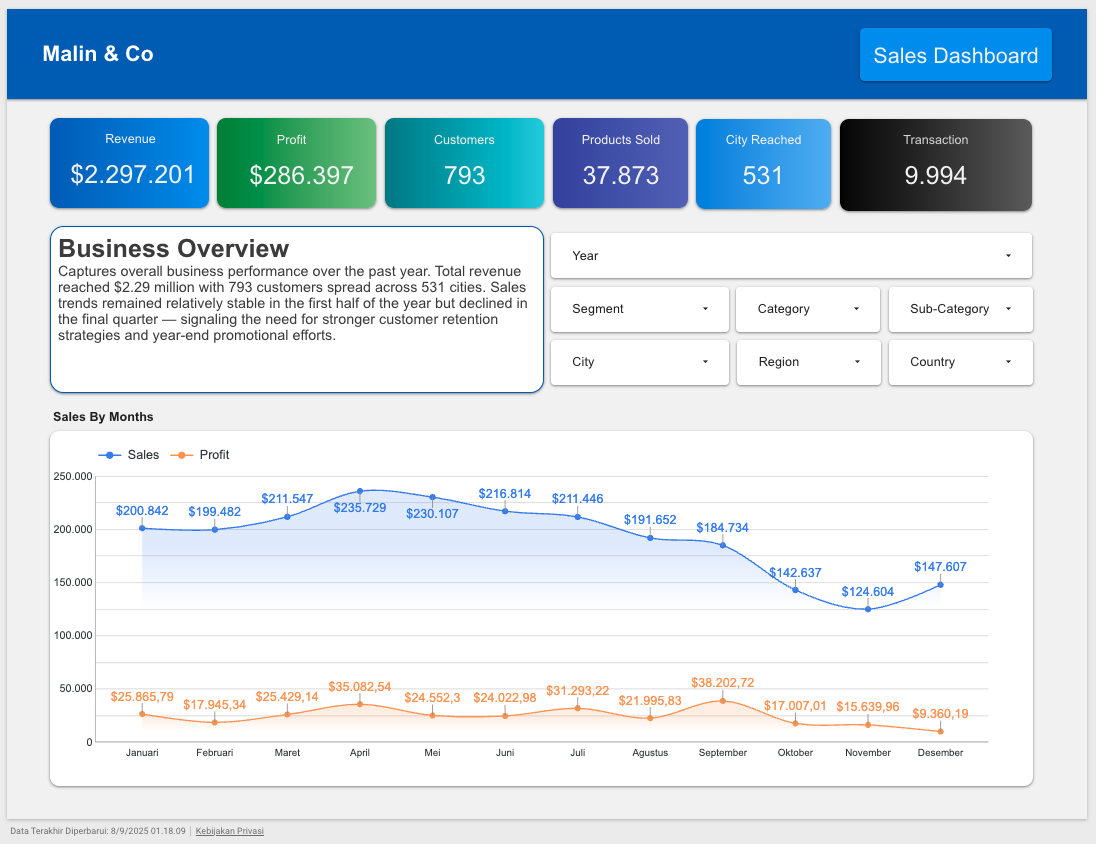
To see it in full you can access it here: Malin Sales Dashboard.
Conclusion
If your business wants to stay competitive in a fast-paced era like today, it is very important to have realtime data analysis so that business decisions can be made quickly and accurately.
A dashboard will help you greatly toward that goal if you do not want to keep falling behind your competitors.