Looker Studio Dashboard
Design, build, and optimize interactive dashboards for marketing, sales, and operations.
- KPI mapping & data contracts
- Custom theme, filters, and controls
- Auto-refresh & scheduled email reports
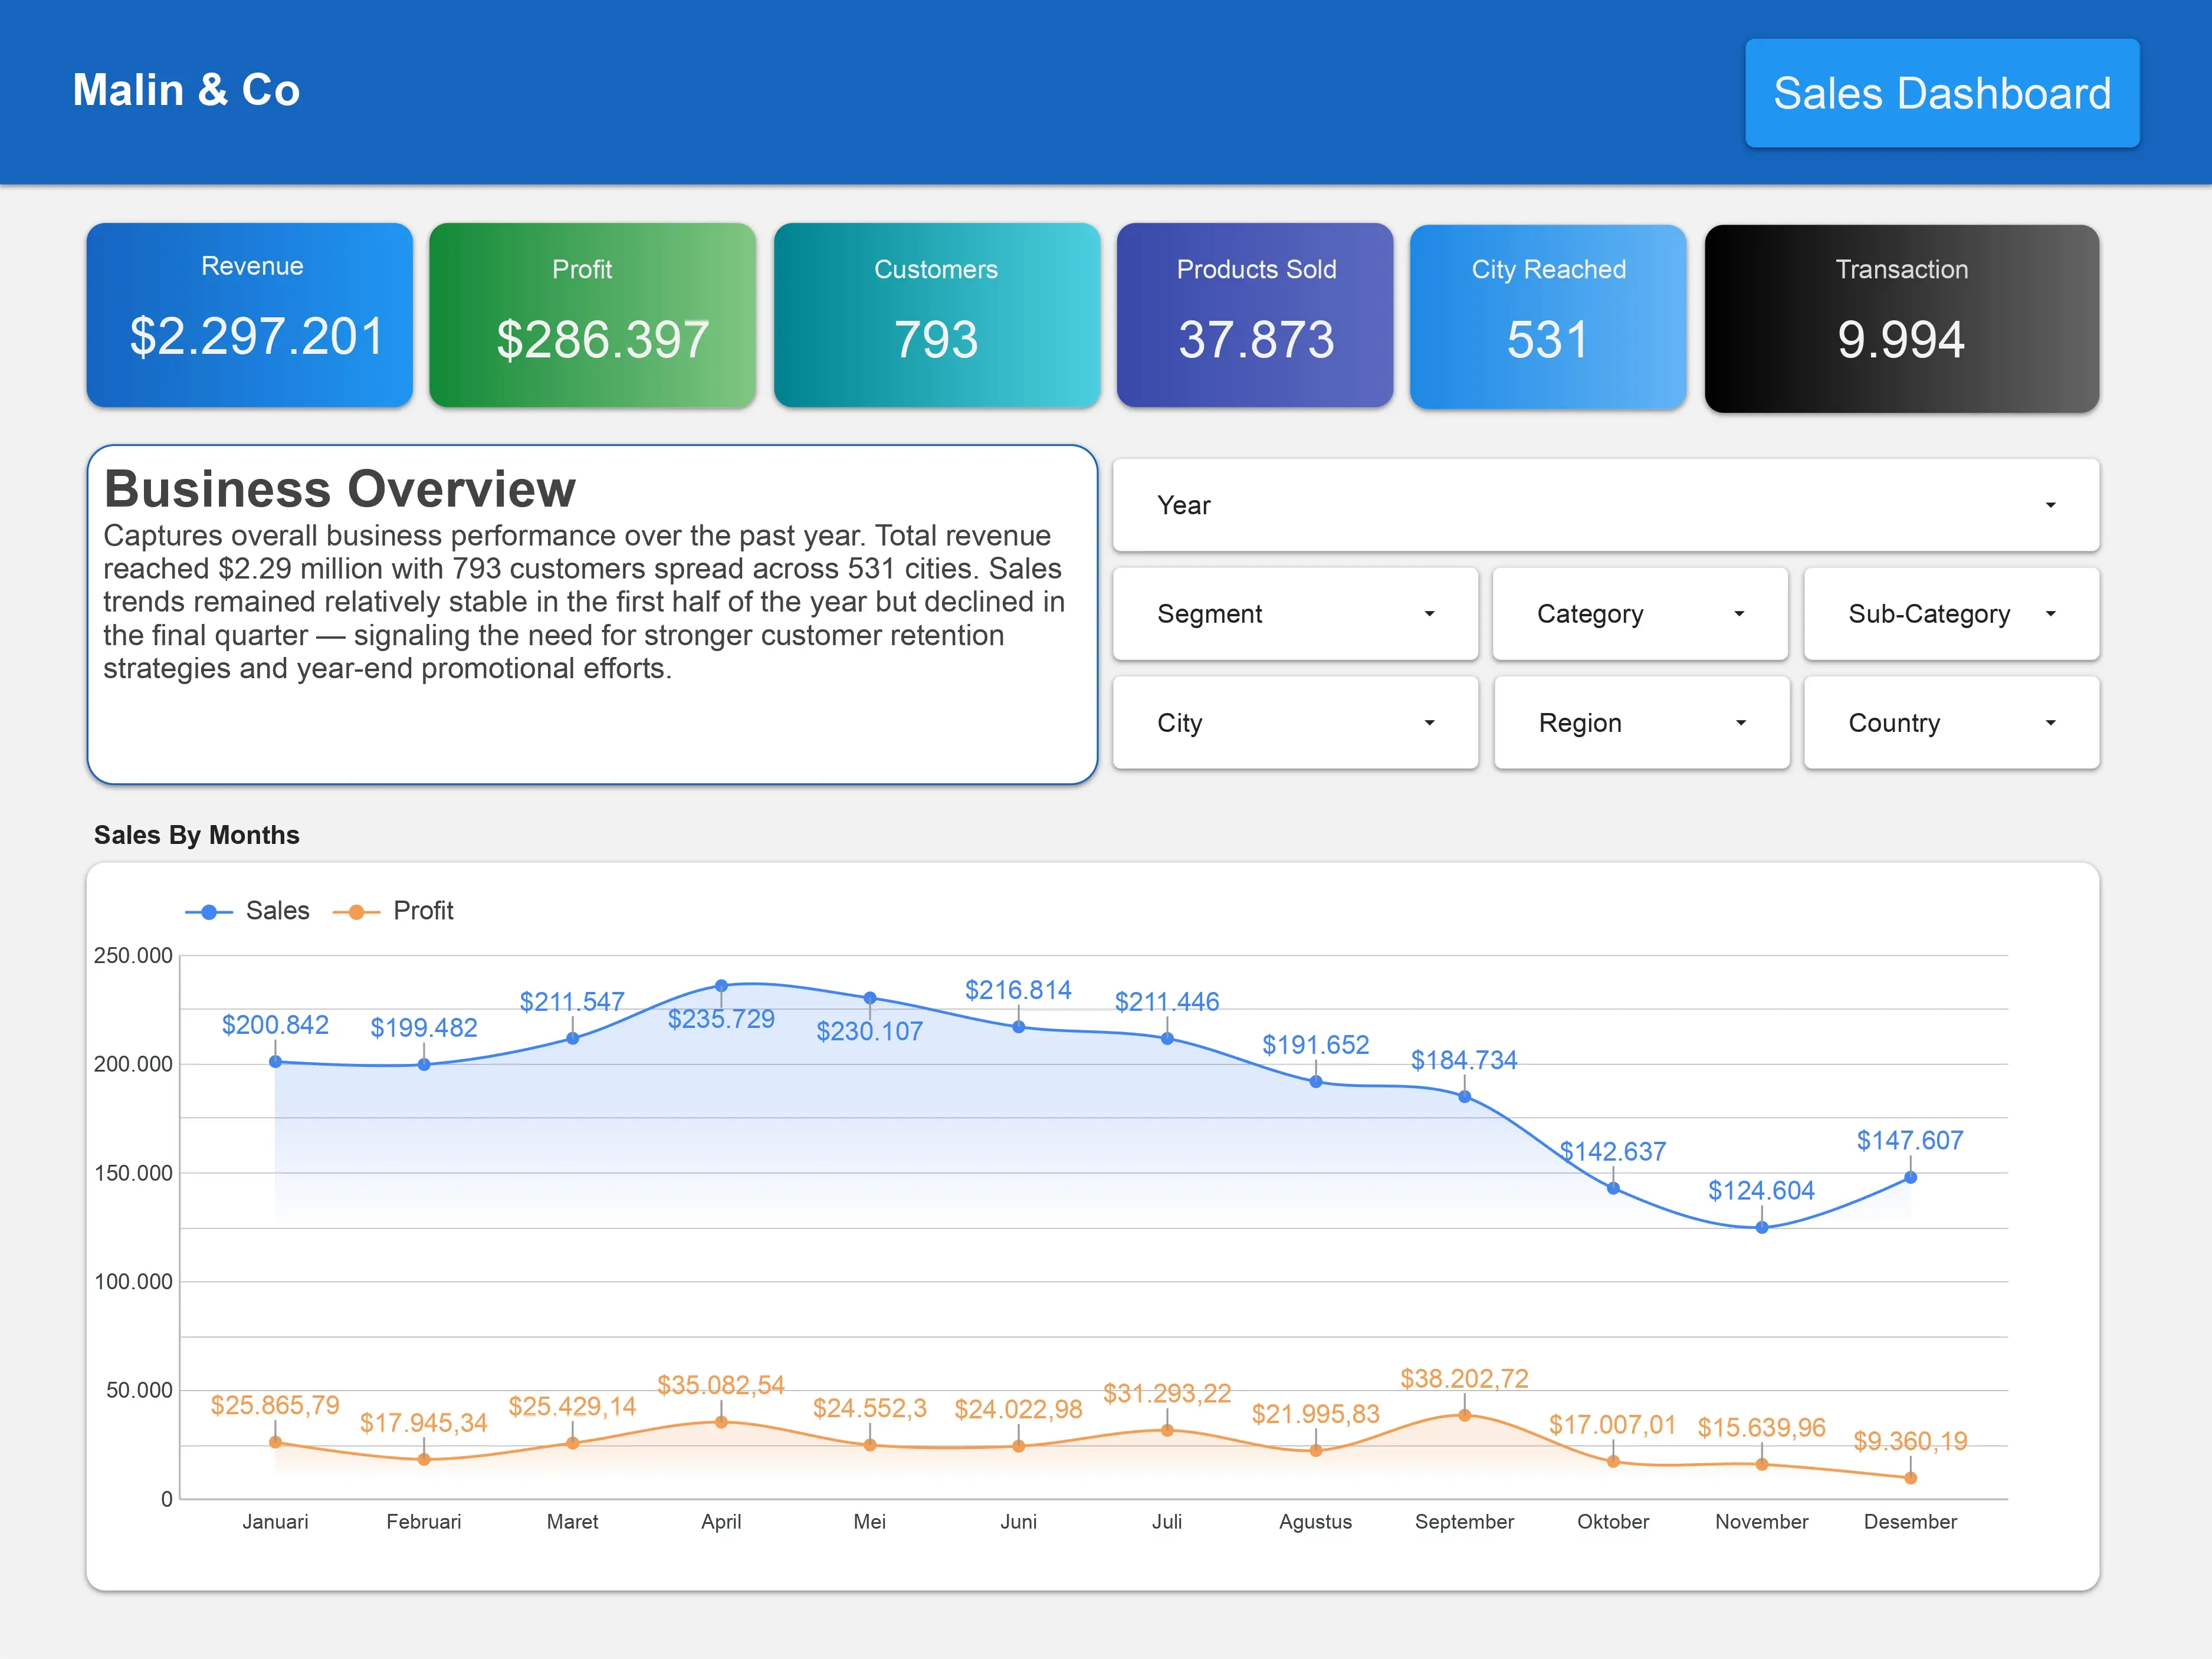
Helping you understand business performance quickly through interactive Data Visualization and Dashboards
From manual spreadsheets to real-time insights that drive your business forward
Monitor business performance at all times. No need to wait for monthly reports to know something is off.
From gut feeling to data-driven decisions. See trends, identify issues, and take action in minutes.
Respond to market changes quickly. Pivot your marketing or operational strategy based on the latest data.
Eliminate human error from manual reporting. One source of truth for your entire team.
Flexible packages tailored to your needs, from SMBs to Enterprise
Design, build, and optimize interactive dashboards for marketing, sales, and operations.
Turn raw data into clear visuals that enable quick decision-making.
Deep analysis for trends, anomalies, and business opportunities: from funnels to cohorts.
Lightweight ETL from Sheets → Looker Studio without complex setup.
A streamlined, transparent process you can track every step of the way
Quick audit of your data sources and business goals. Define key KPIs and dashboard priorities.
Sign a Non-Disclosure Agreement if needed for data security.
Dashboard design, data connection setup, data model implementation, and build according to the approved design.
User acceptance testing with your team, quick iterations, and usage documentation.
Dashboard training, video walkthrough, and optional maintenance support.
Transparent pricing—final details discussed after a discovery call
Ideal for small businesses with a single data source
Perfect for SMEs with multiple data sources
Enterprise solution with advanced features
Answers to commonly asked questions
Send your sample data (dummy data is fine), and I'll review it and provide a free dashboard structure recommendation.
halo@emen.web.id | +62 819-4514-0191